Identify the energy source
Which edge, switching node, or transient is injecting energy?
Narrowband emission near 150 MHz, approximately 8 dB over limit
HARNESS / OPERATING MODE1.0 m harness from connector to external load · ECU in normal operation
FIELD starts with energy, current loops, coupling paths, and verification—not with a standards list or an unstructured document archive.
Conceptual model · not a simulation · evidence level L1. Use the trend to build intuition; absolute field strength requires CISPR 25 measurement. Limit: small-loop/far-field approximation; for length > λ/2, multi-lobe behavior invalidates a simple monopole approximation.
The core reference provides a repeatable reasoning method: locate the source, close the current loop, identify the coupling structure, and prove the hypothesis by measurement.
Which edge, switching node, or transient is injecting energy?
Where does current leave, and through which impedance does it return?
Which loop, cable, aperture, or structure converts energy into a field?
Can source, path, or victim impedance be changed to reduce risk?
Which measurement can support or falsify the current physical hypothesis?
The model places return-path detours, differential-to-common-mode conversion, and ESD branch inductance in one source–path–victim coordinate system.
The return current detours 80 mm around a plane gap; the same geometry becomes electrically larger as frequency rises.
Each domain begins with one engineering question and links physical mechanisms, design decisions, interactive models, cases, and evidence.
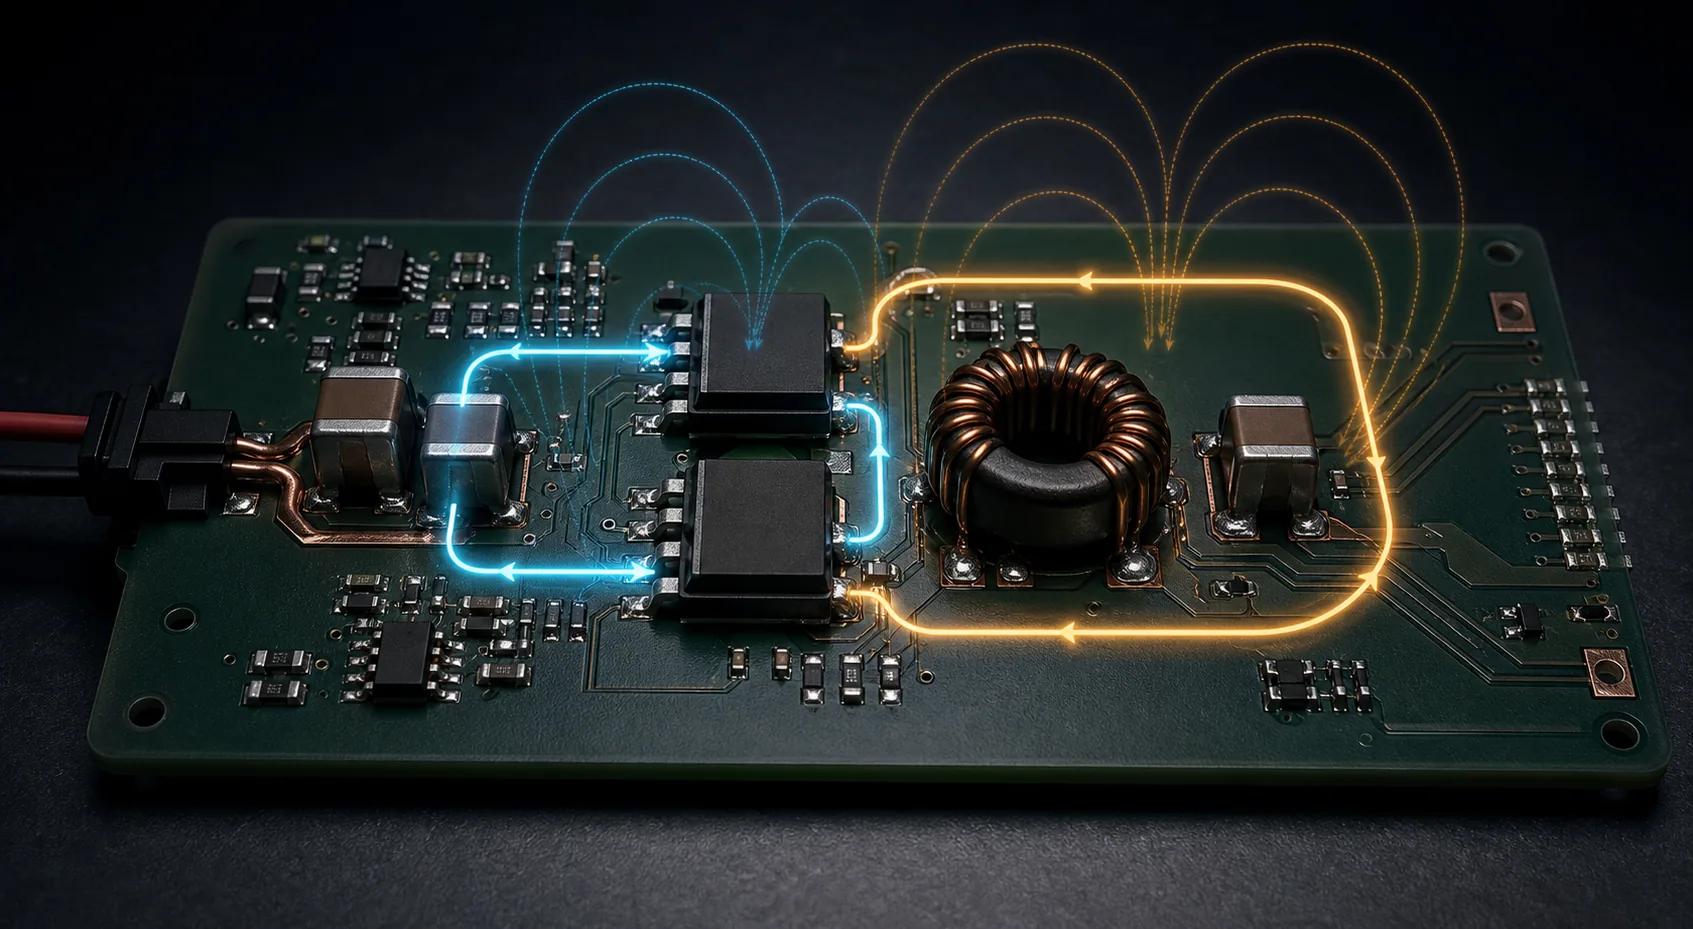 01
01How small is the high-di/dt loop, and how large is the high-dv/dt copper area?
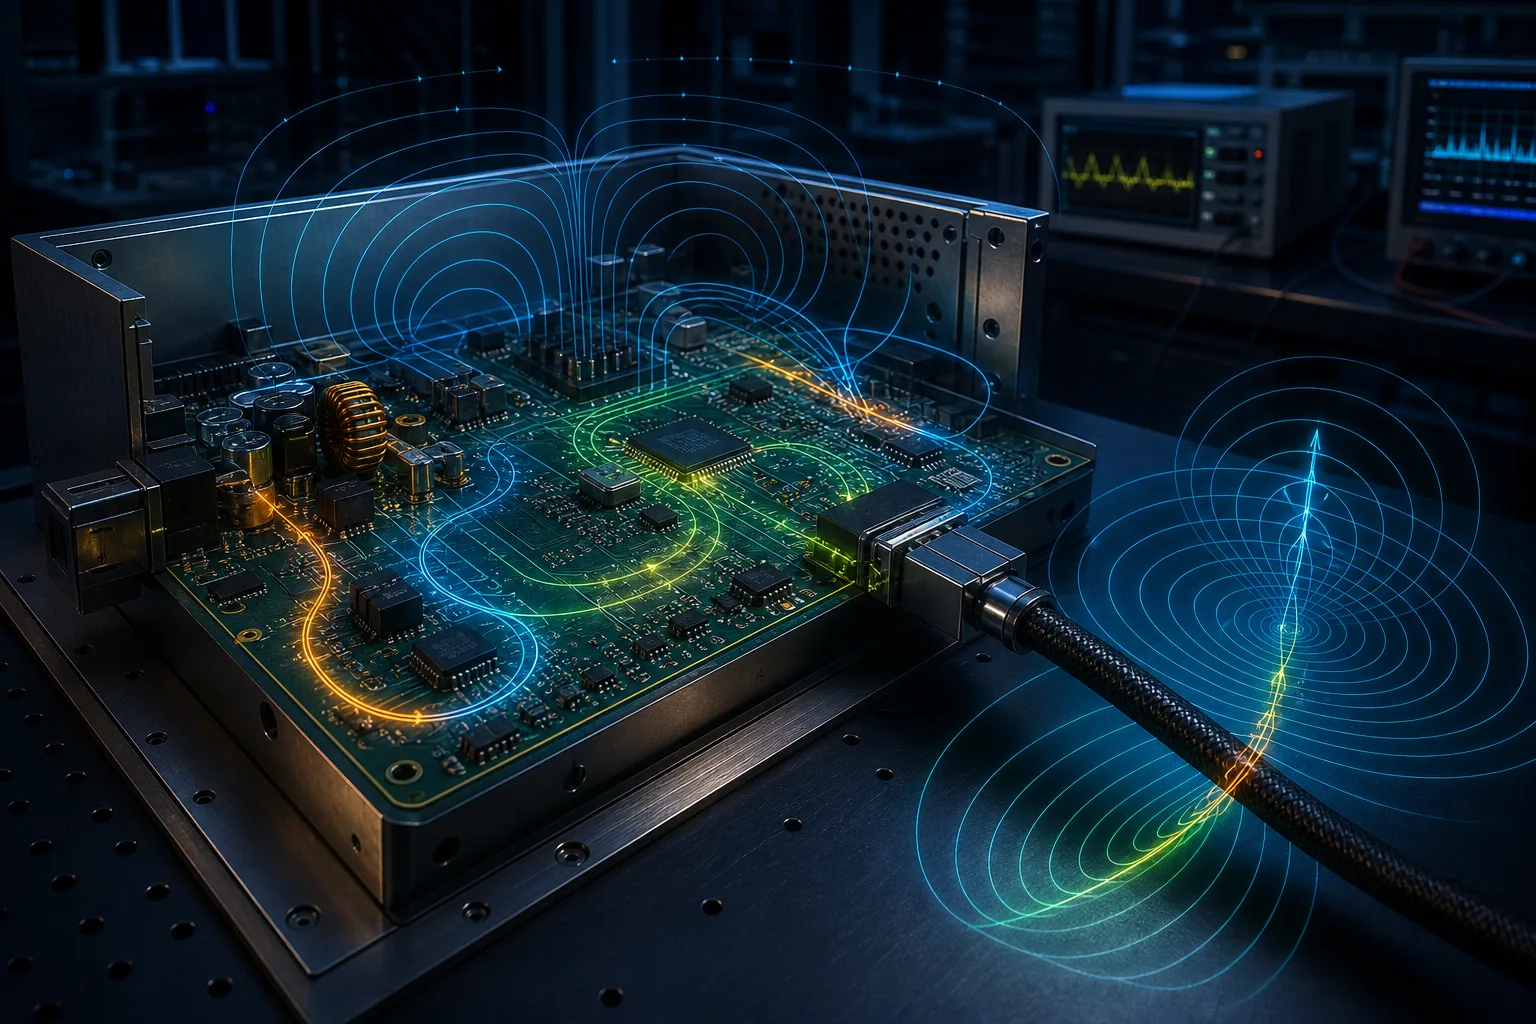 02
02Is emission bandwidth governed by clock frequency or edge rate?
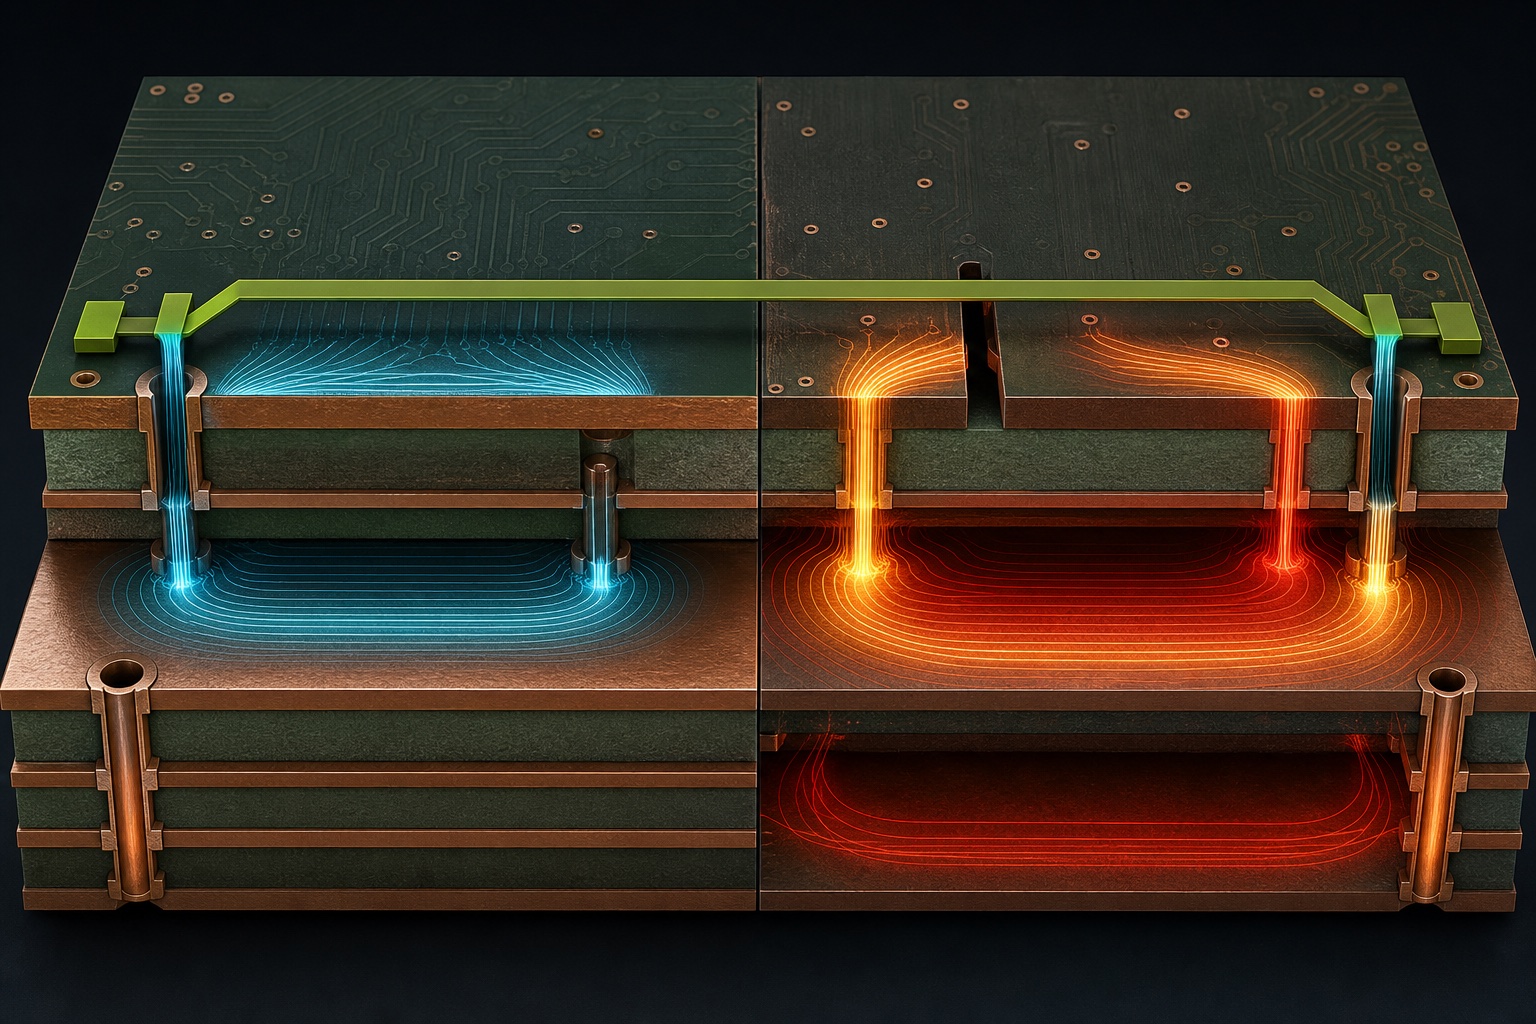 03
03Does every critical trace have an adjacent, continuous reference through layer transitions?
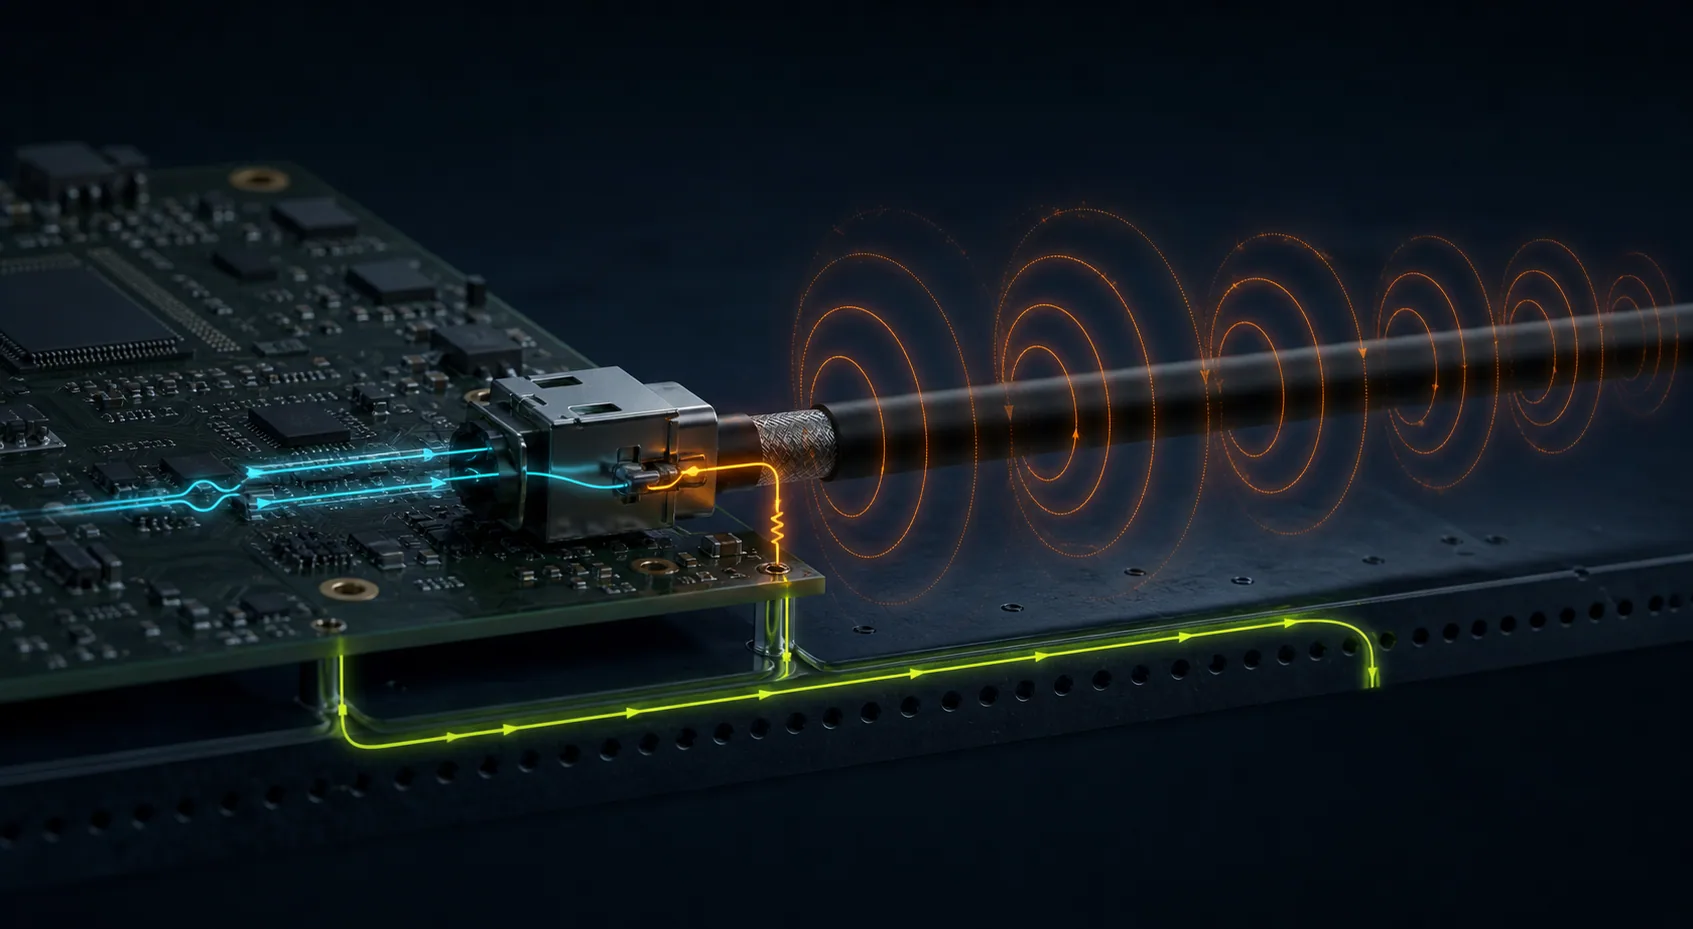 04
04Where can differential imbalance convert into cable common-mode current?
 05
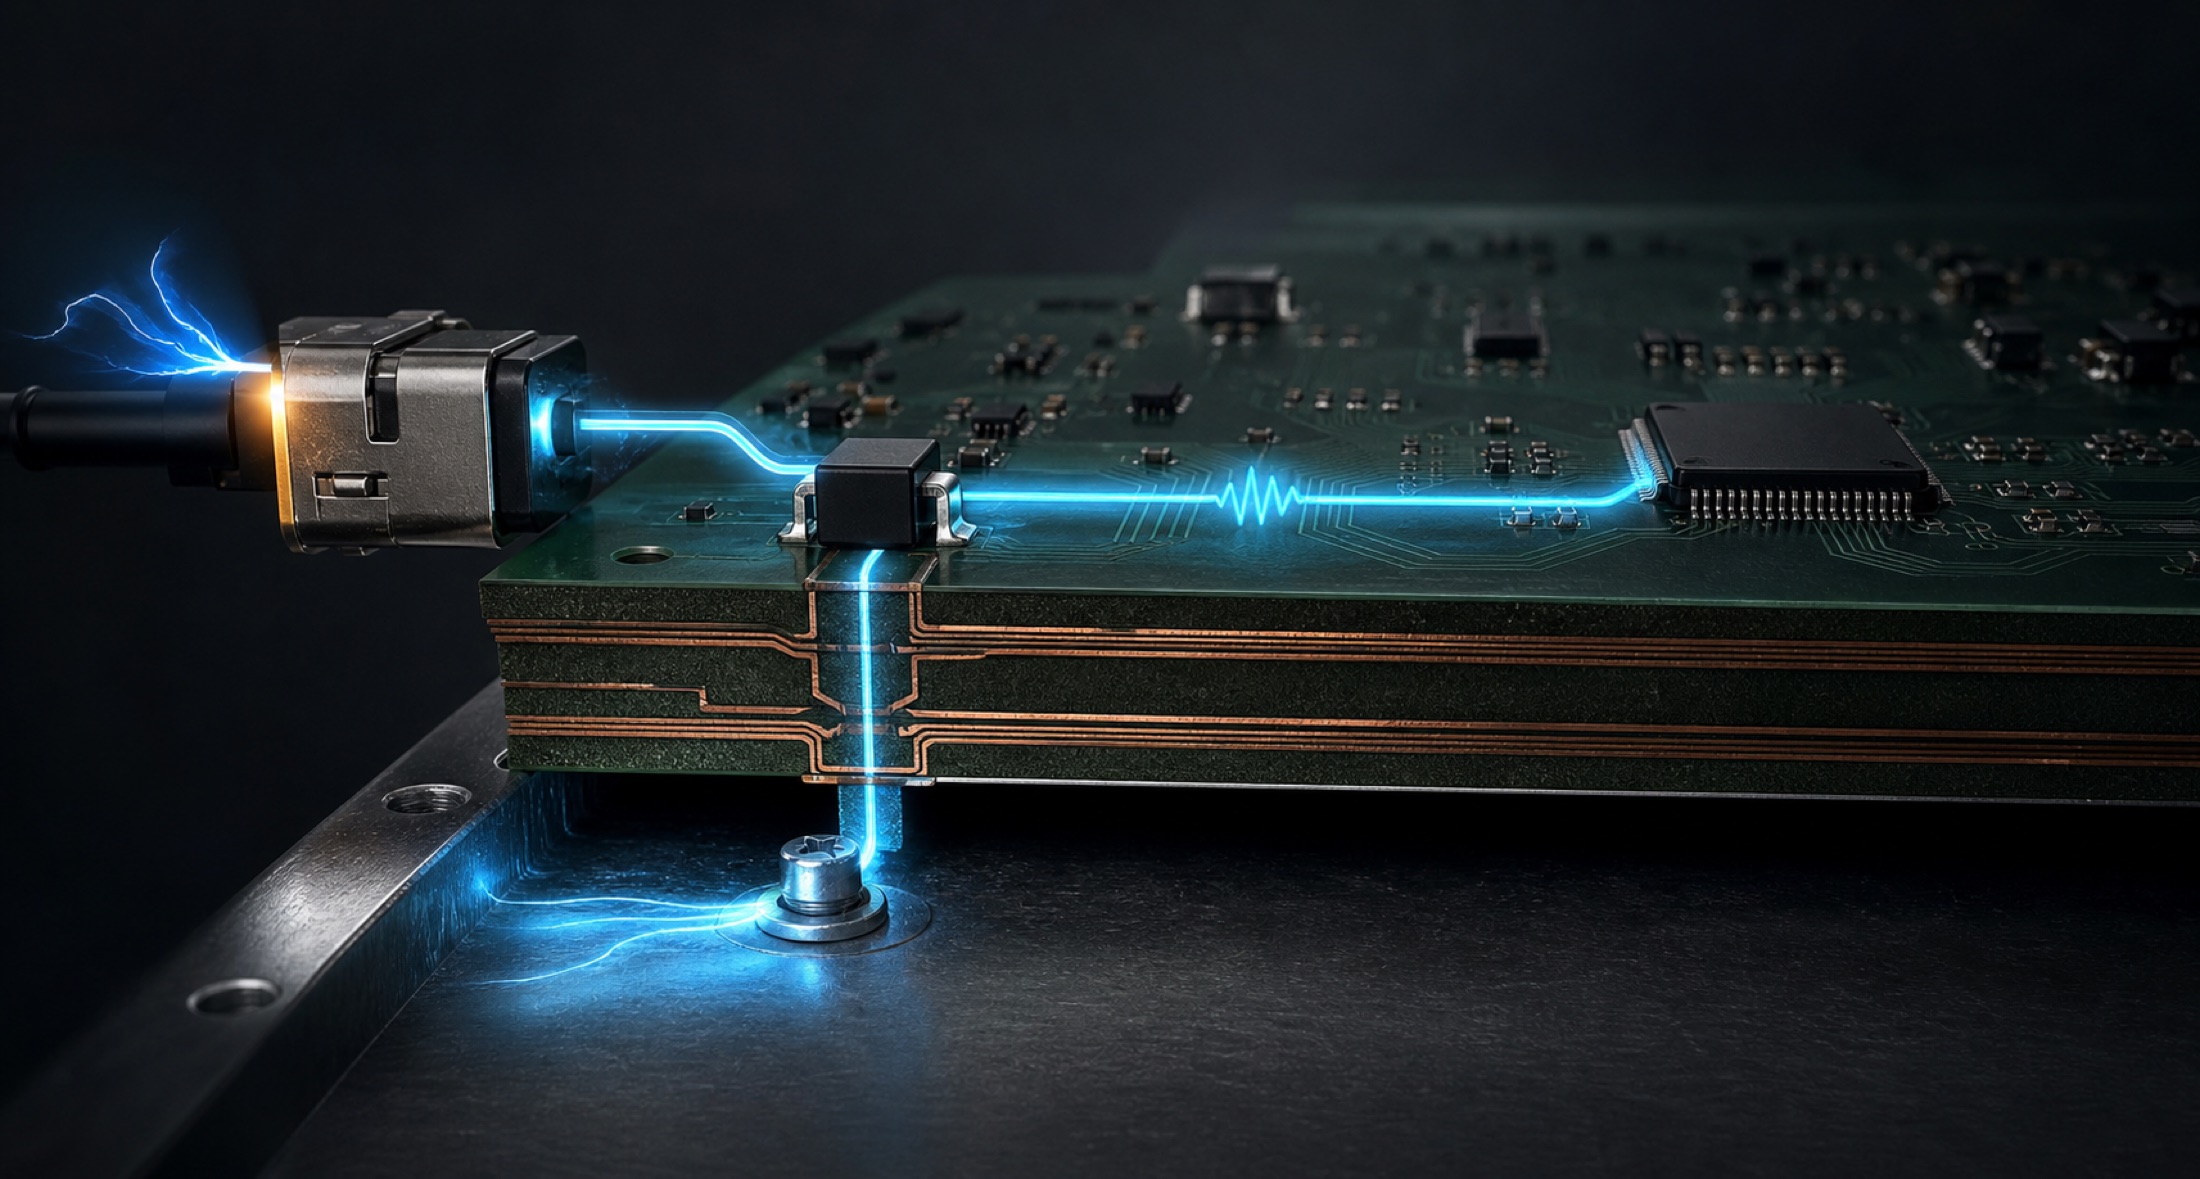
05Can pulse current be diverted through a short, wide path before it reaches sensitive circuitry?
 06
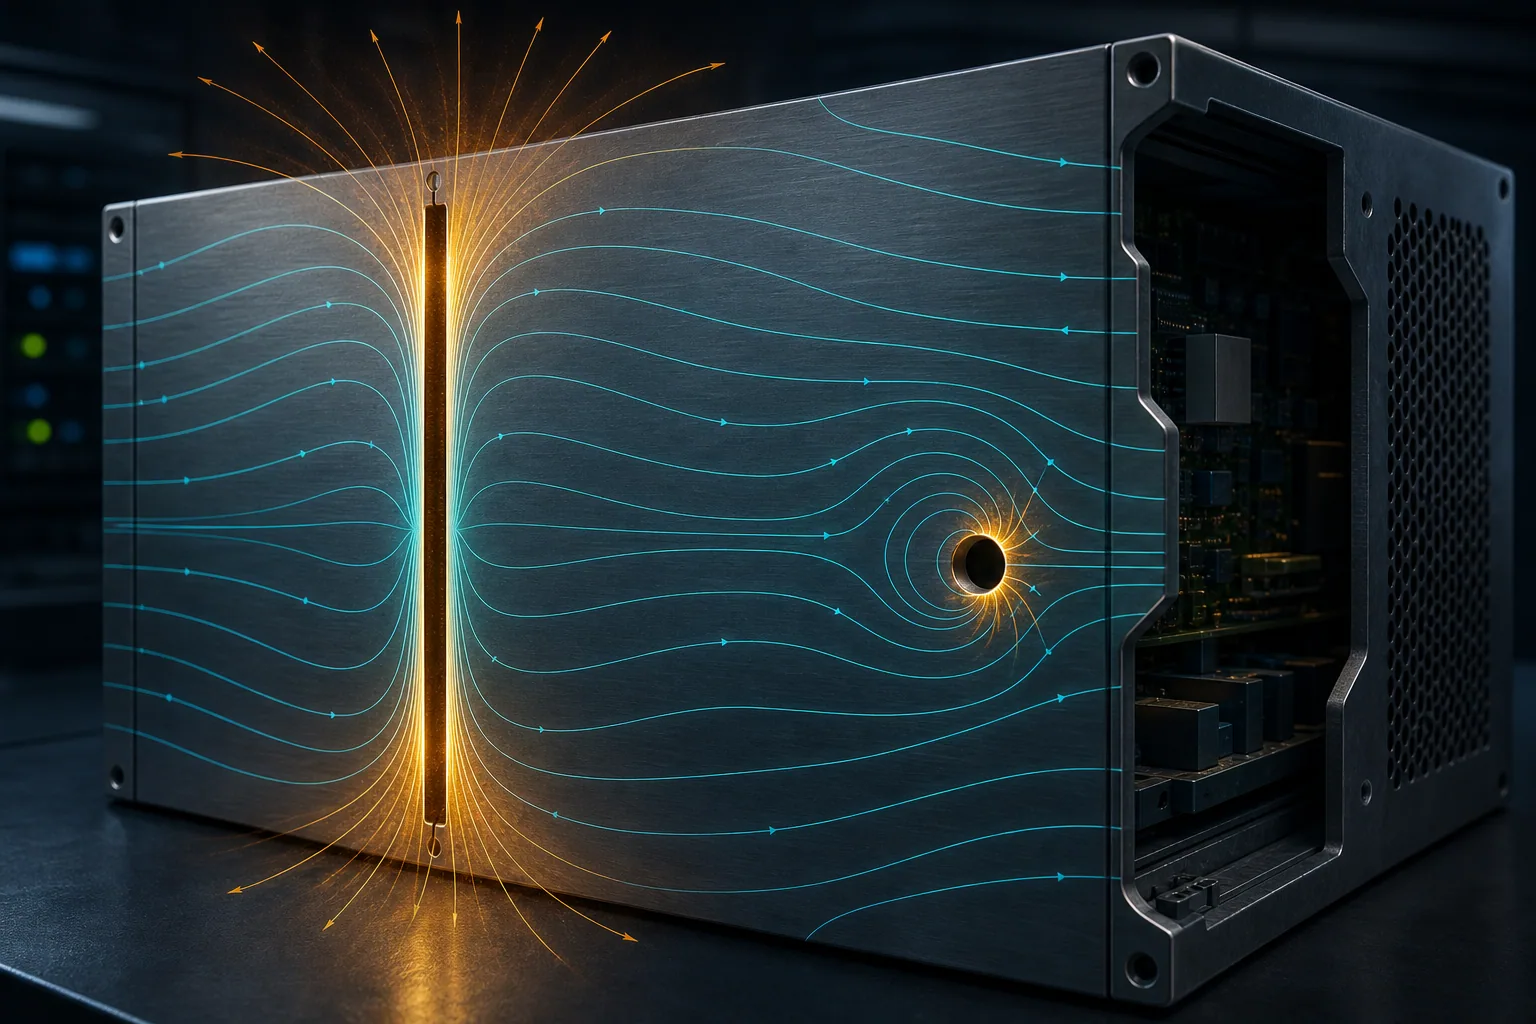
06Which seam interrupts surface current, and where does the cable shield terminate?
The spectrum lab shows why high-frequency EMI content is governed more by edge rate than by the digital fundamental.
Use fedge ≈ 1/(πTr) to estimate the trapezoidal edge-spectrum breakpoint. It is not a hard cutoff; package, drive impedance, ringing, and duty cycle alter the measured spectrum.
Four journeys cover understanding, design, verification, and corrective action. The 565 resources remain available as an evidence and deep-reading layer.
Explain EMC behavior through edges, current loops, fields, and impedance
Identify high-risk paths in schematics, layout, and mechanical design
Turn market, ports, phenomena, and performance criteria into a test matrix
Converge with frequency relationships, path evidence, and one-variable experiments
Cases are structured as frequency relationship–physical path–verification action, creating reusable and auditable diagnostic patterns.
CLK133 runs parallel to the differential pair, while asymmetric vias increase mode conversion.
The replacement part has a shorter rise time, extending emission energy into higher bands.
Board-level digital noise couples through the LED route and connector into the Ethernet cable.
AI combines references, cases, frequency relationships, and experiment actions into an executable next step without replacing engineering judgment or measurement evidence.
Trace the shortest discharge-current path
→Monitor RESET and supply-rail transients
→Compare TVS placement, loop inductance, and clamping margin
→Global sources confirm physical limits, track standards, and extend coverage of modern interfaces and test methods. Links prioritize publishers and original manufacturers.
System-level ESD test foundation
Multimedia emissions and immunity
Automotive radiated and transient phenomena
2025 MCU EMC design guidance
High-speed PCB and return-path guidance
Pre-compliance measurement and localization
Make formal compliance a confirmation—not the first time a problem is discovered.
Start an EMC design review ↗